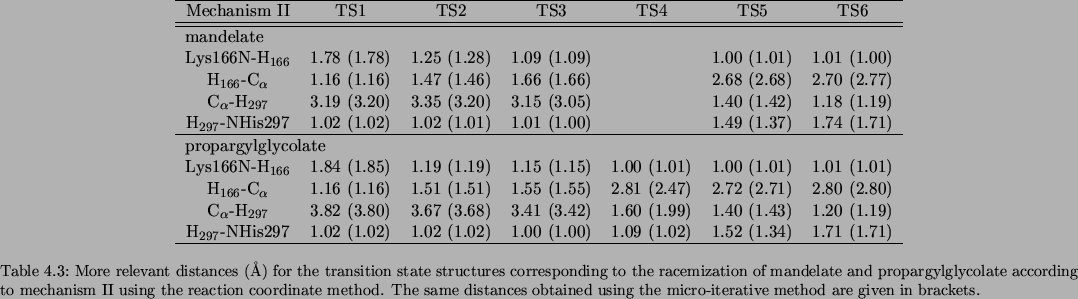
The more relevant distances for the transition state structures corresponding to the racemization of mandelate and propargylglycolate according to mechanisms I, II and III (located using the reaction coordinate method and the micro-iterative method) are presented in Tables 3.11, 3.12 and 3.13, respectively.
| ||||||||||||||||||||||
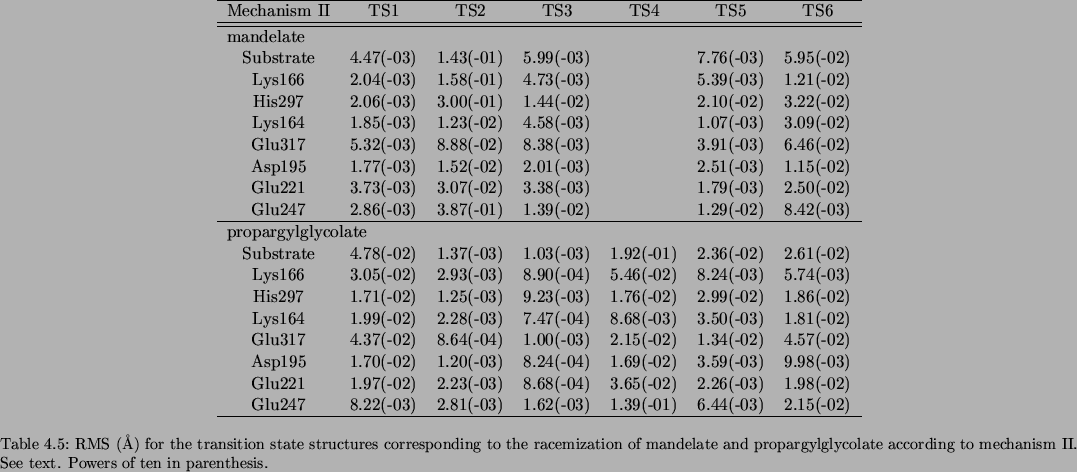
Since many atoms move in each step, we have also compared the positions of the main residues of the active center at the transition state structures located using the two methods. To this aim we have calculated the root mean square (RMS) of the difference between the coordinates of the atoms at the transition state structures obtained employing the reaction coordinate method and the structures located by means of the micro-iterative method. These RMS values are shown in tables 3.14, 3.15 and 3.16 for mechanisms I, II and III, respectively. The rest of the residues of the active center give lower values of RMS and are not included in the tables.
| ||||||||||||||||||||||||||||||||||||||
It can be seen that there are not significant divergences between both sets of transition state structures in most of the steps of the mechanisms. The discrepancies in general have no important consequence on the potential energy barriers: See, for instance, that a deviation of even 0.15 Å (Table 3.12) between the TS2 corresponding to mechanism II for mandelate, along with some RMS values of the order of 0.1 Å (table 3.15) of the residues in the active center, produces a change of only -0.31 kcal/mol in the corresponding energy barrier (table 3.9).
The step 4 of mechanism I and II of propargylglycolate is a especial case in which the
transition state structures obtained with the two methods differ significantly (Tables
3.11, 3.12, 3.14 and 3.15).
This explains the energy difference already seen in this step as well. The differences
appear in residue Lys166 and in the substrate. In Figure 3.6 we can do a visual inspection of
what is happening. That is, the hydroxyl group of propargylglycolate points to different
directions, the conformation of the amino group in Lys166 is slightly different and the C![]() atom presents a different degree of configurational change. The Asp195 residue is depicted
to realize the different conformation of Lys166. Then, we can see in this case that the
differences are not only in the distances associated to the transferring hydrogens
(Tables 3.11 and 3.12)
but in the immediate surrounding. Note that this step 4 consists basically of the
configuration change of the C
atom presents a different degree of configurational change. The Asp195 residue is depicted
to realize the different conformation of Lys166. Then, we can see in this case that the
differences are not only in the distances associated to the transferring hydrogens
(Tables 3.11 and 3.12)
but in the immediate surrounding. Note that this step 4 consists basically of the
configuration change of the C![]() atom, the reaction coordinate chosen in this case (the distance
between the transferring hydrogen and the acceptor heavy atom) not being perhaps the most
adequate.
atom, the reaction coordinate chosen in this case (the distance
between the transferring hydrogen and the acceptor heavy atom) not being perhaps the most
adequate.
![\includegraphics[width=0.6\textwidth]{Figures/lysiprpCOOR.eps}](img529.png)
![\includegraphics[width=0.6\textwidth]{Figures/lysiprpRFO.eps}](img530.png)
|
It is important to remark that in all cases but in the step 4 (mechanisms I and II) for propargylglycolate we have found a negative eigenvalue from the beginning and a corresponding eigenvector that describes the step. In step 4 the initial structure (that is, the transition state structure obtained from the reaction coordinate method) had no transition vector. This means that the proposed structure according to the reaction coordinate method was away from the quadratic region with the suitable curvature corresponding to the actual transition state structure of this step. So in this case we are not just dealing with the convenience of the refinement of the coordinates and the potential energy of the located structure but with the problem of a transition state structure provided by the reaction coordinate method that may not fulfill the adequate mathematical conditions to be considered at least, as an approximation to the real transition state structure of the corresponding step.
As for the TS1 of the mechanism I of propargylglycolate, the main divergence between
both transition state structures comes from the two distances associated with the transferring
hydrogen from Lys164 to the appropriate carboxylate oxygen atom of the substrate: 1.451 Å and
1.056 Å for the Lys164-N![]() H and the H
H and the H![]() OOC distances, respectively, according to
the reaction coordinate method, but 1.298 Å and 1.209 Å, respectively, arising from the
micro-iterative method. These differences, which could be avoided using a denser grid along
the reaction coordinate method, leads to the corresponding potential energy barrier
disagreement in Table 3.10.
OOC distances, respectively, according to
the reaction coordinate method, but 1.298 Å and 1.209 Å, respectively, arising from the
micro-iterative method. These differences, which could be avoided using a denser grid along
the reaction coordinate method, leads to the corresponding potential energy barrier
disagreement in Table 3.10.